Original case study - https://www.groovejones.com/exxonmobil_css_ar/
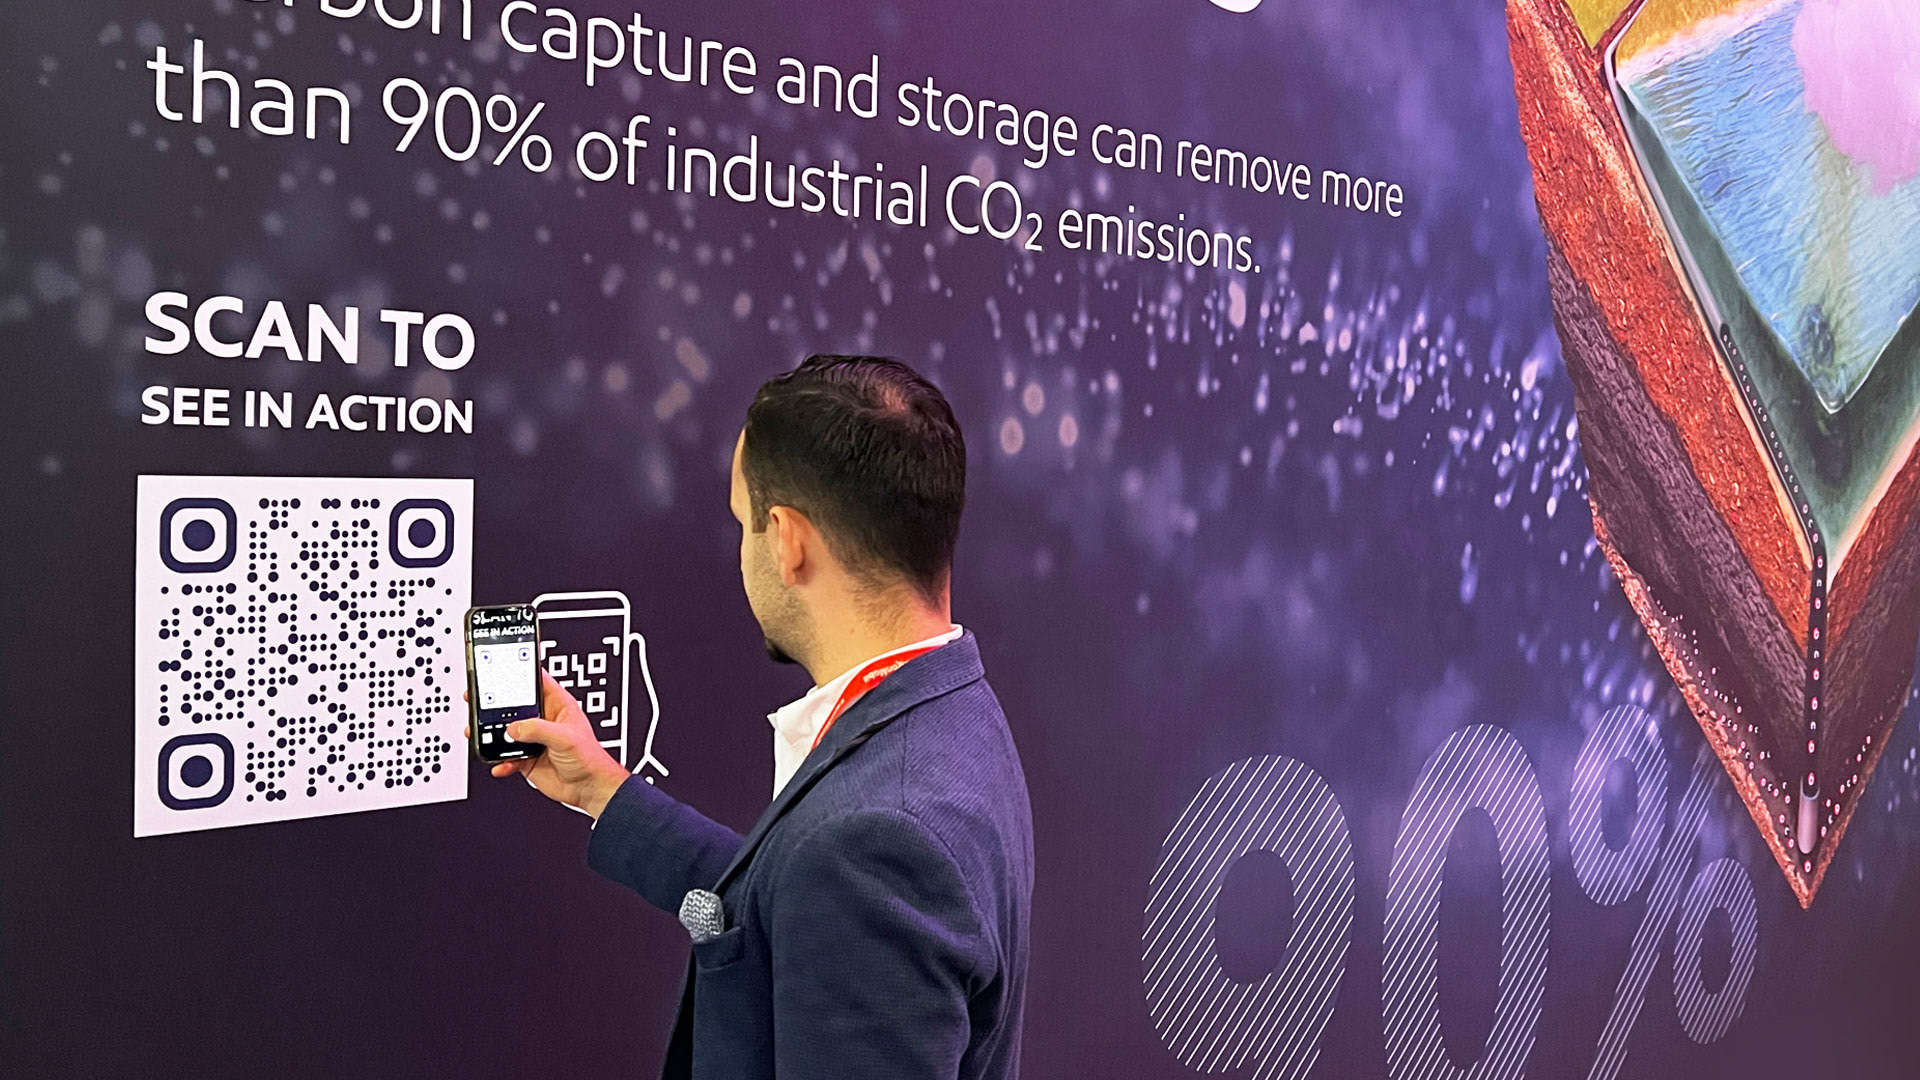
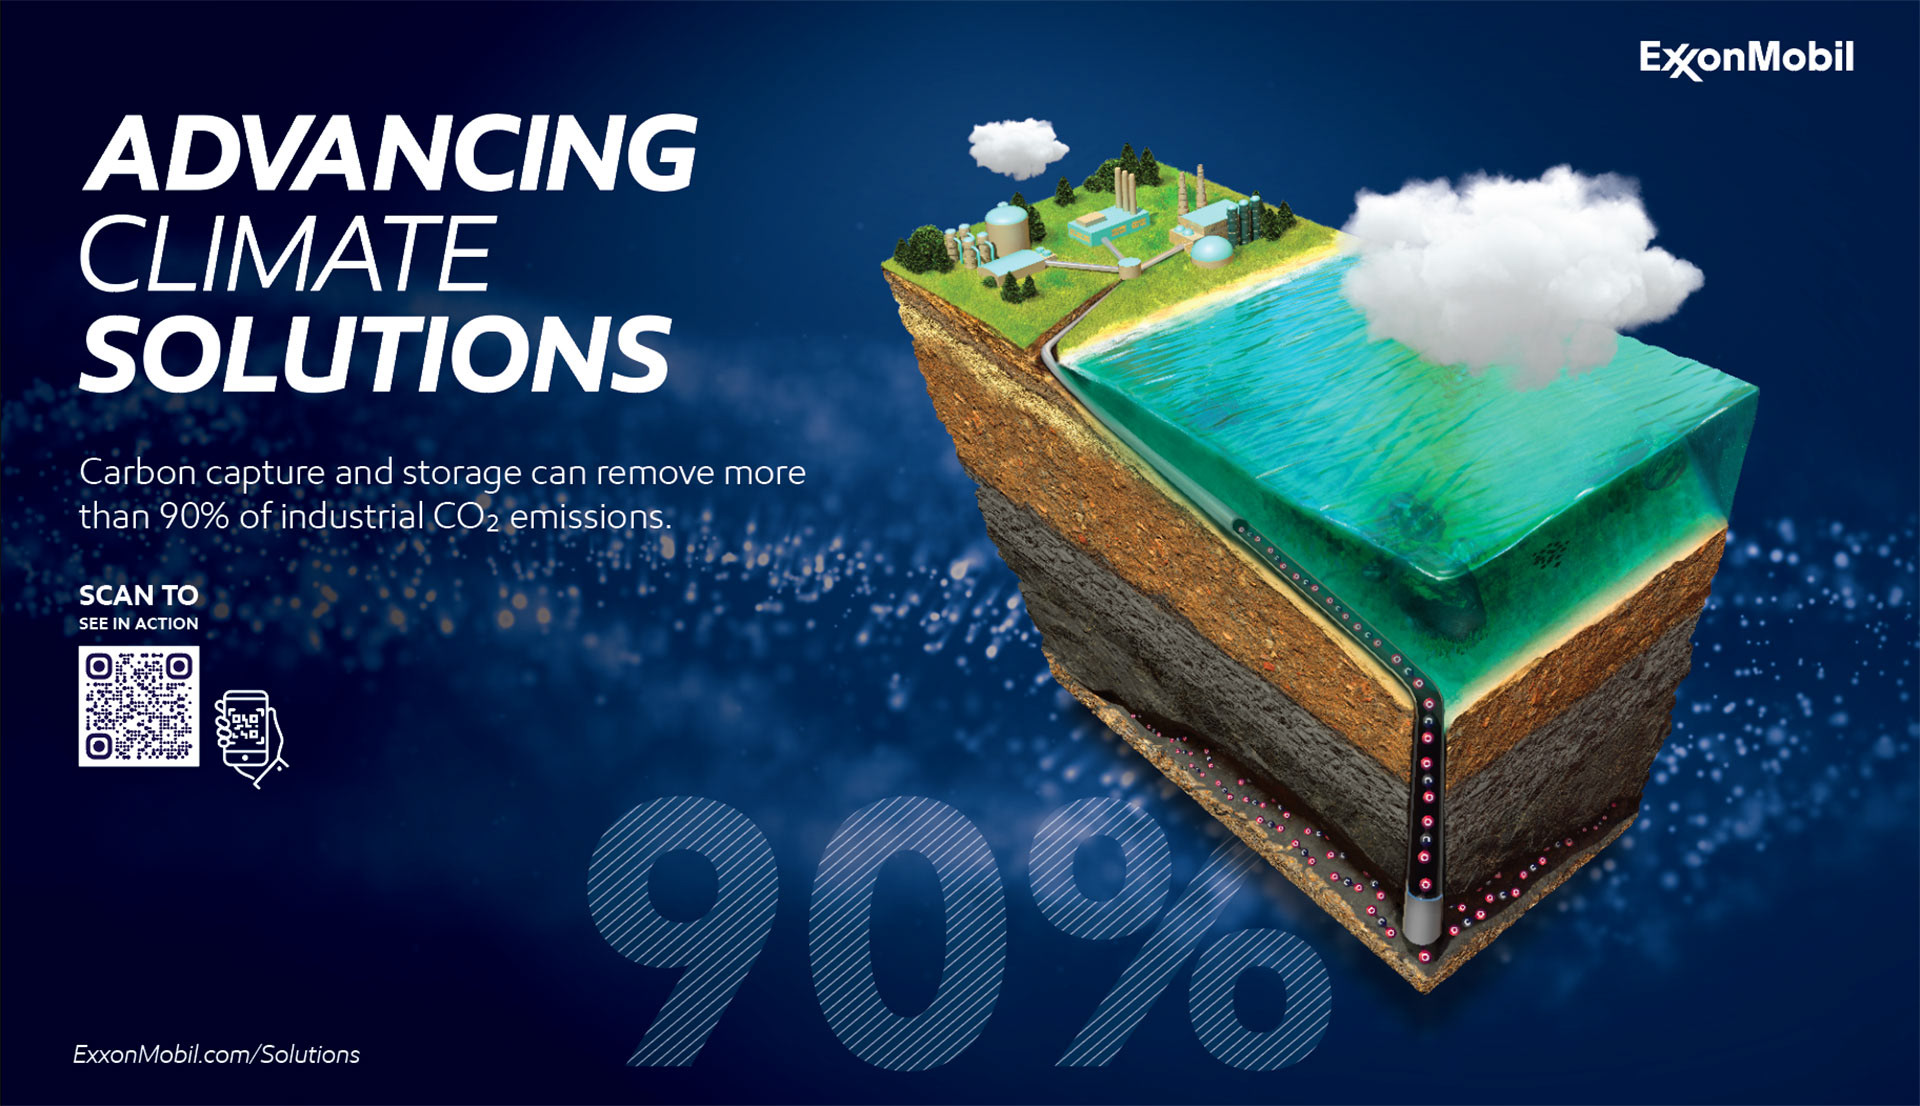
ExxonMobil is Using An Innovative AR Experience To Showcase How Carbon Capture Storage Can Remove 90% of Industrial CO2 Emissions
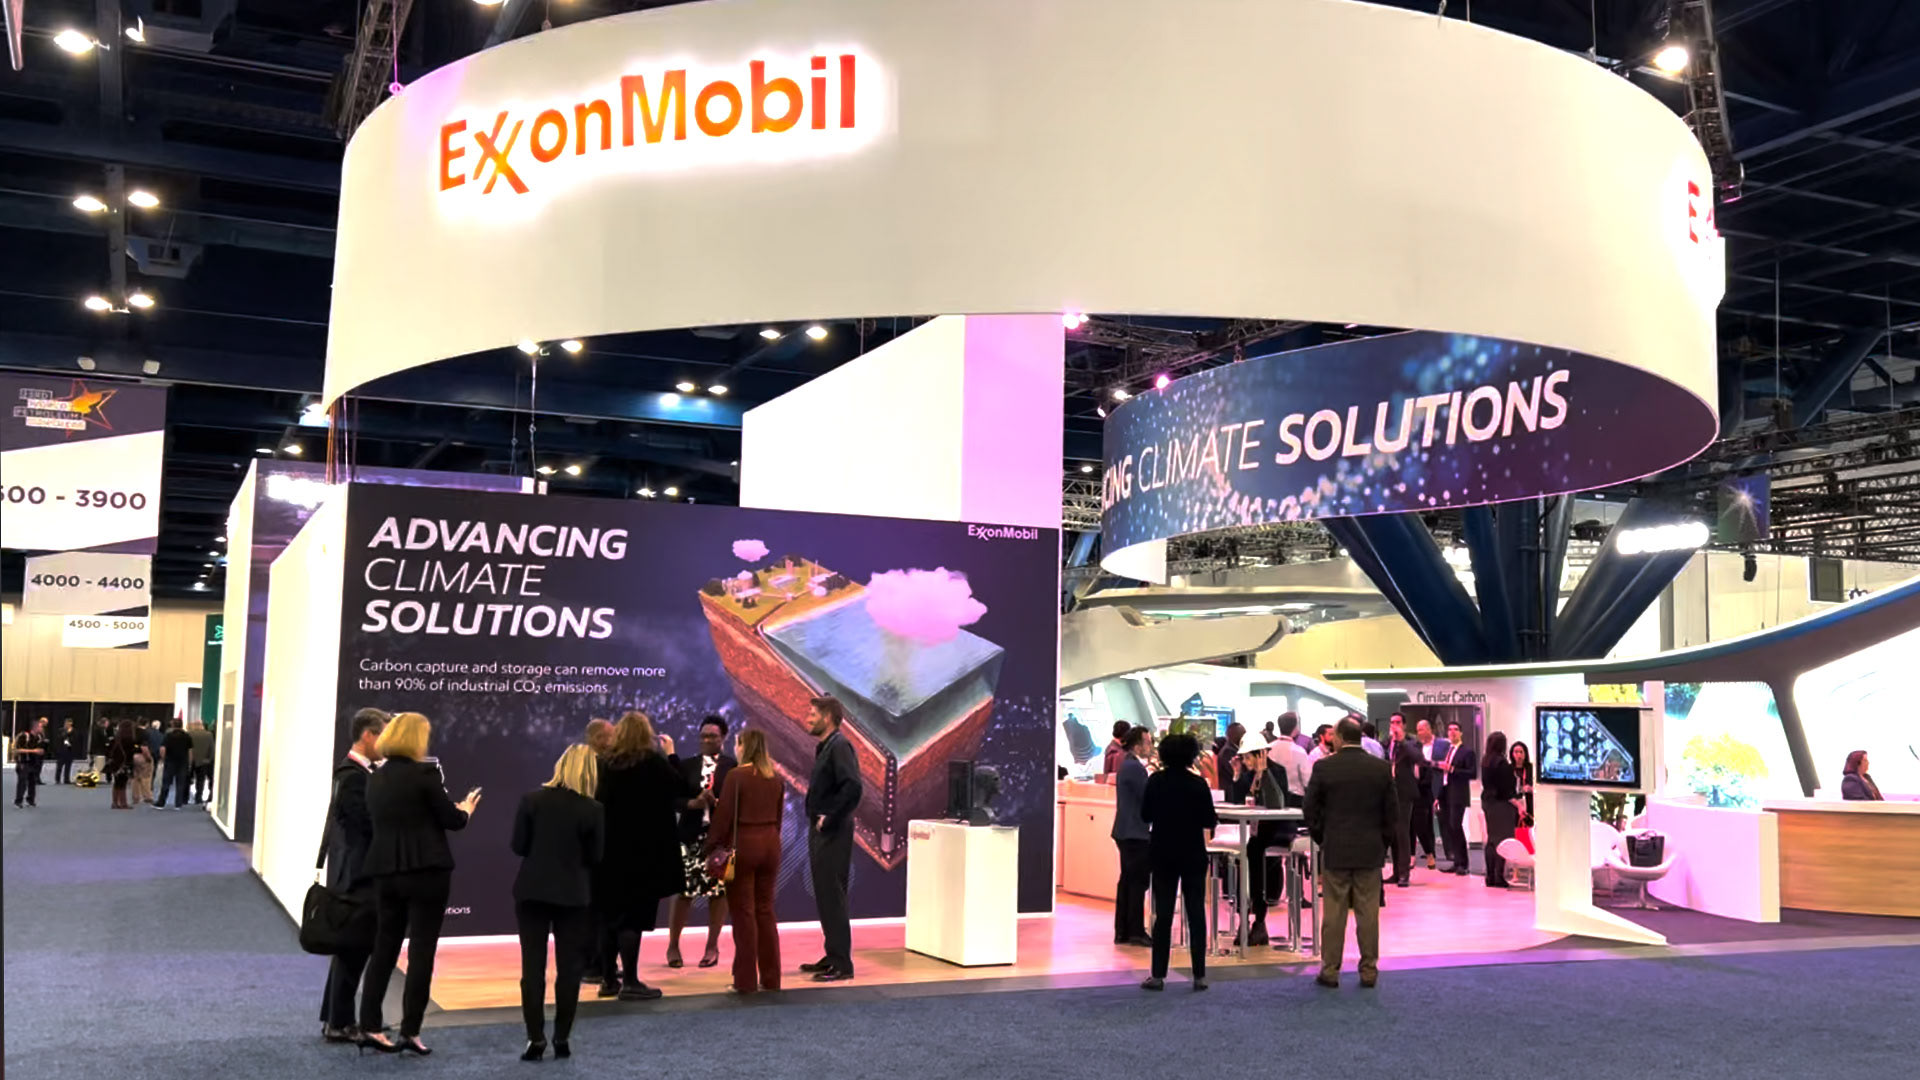
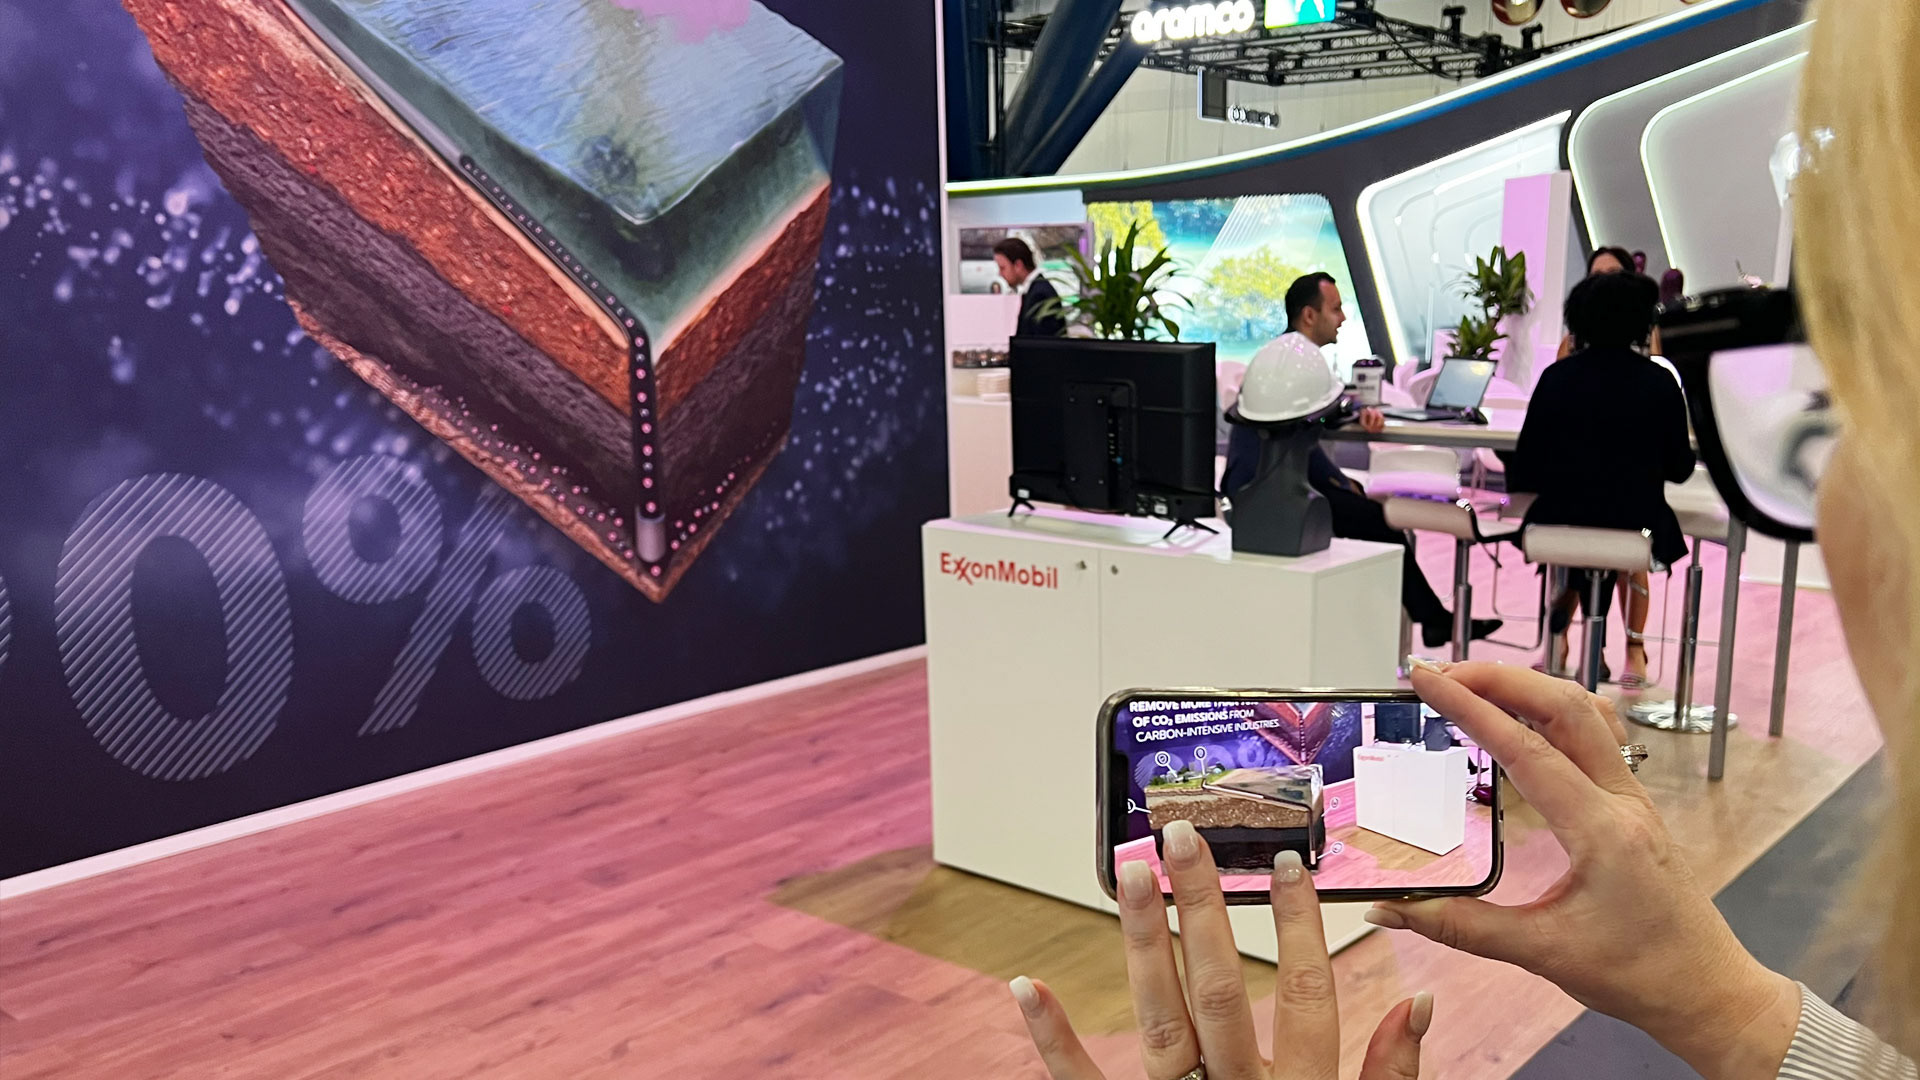
ExxonMobil Corporation (“ExxonMobil”) worked with Groove Jones to build an AR experience for the most recent World Petroleum Congress held in Houston, Texas. The AR experience was used in conjunction with a printed wall mural that was part of their booth at the event.
The AR activation is an innovative and engaging experience that showcases ExxonMobil’s leadership and technology expertise in the global energy transition to a lower-carbon energy future.
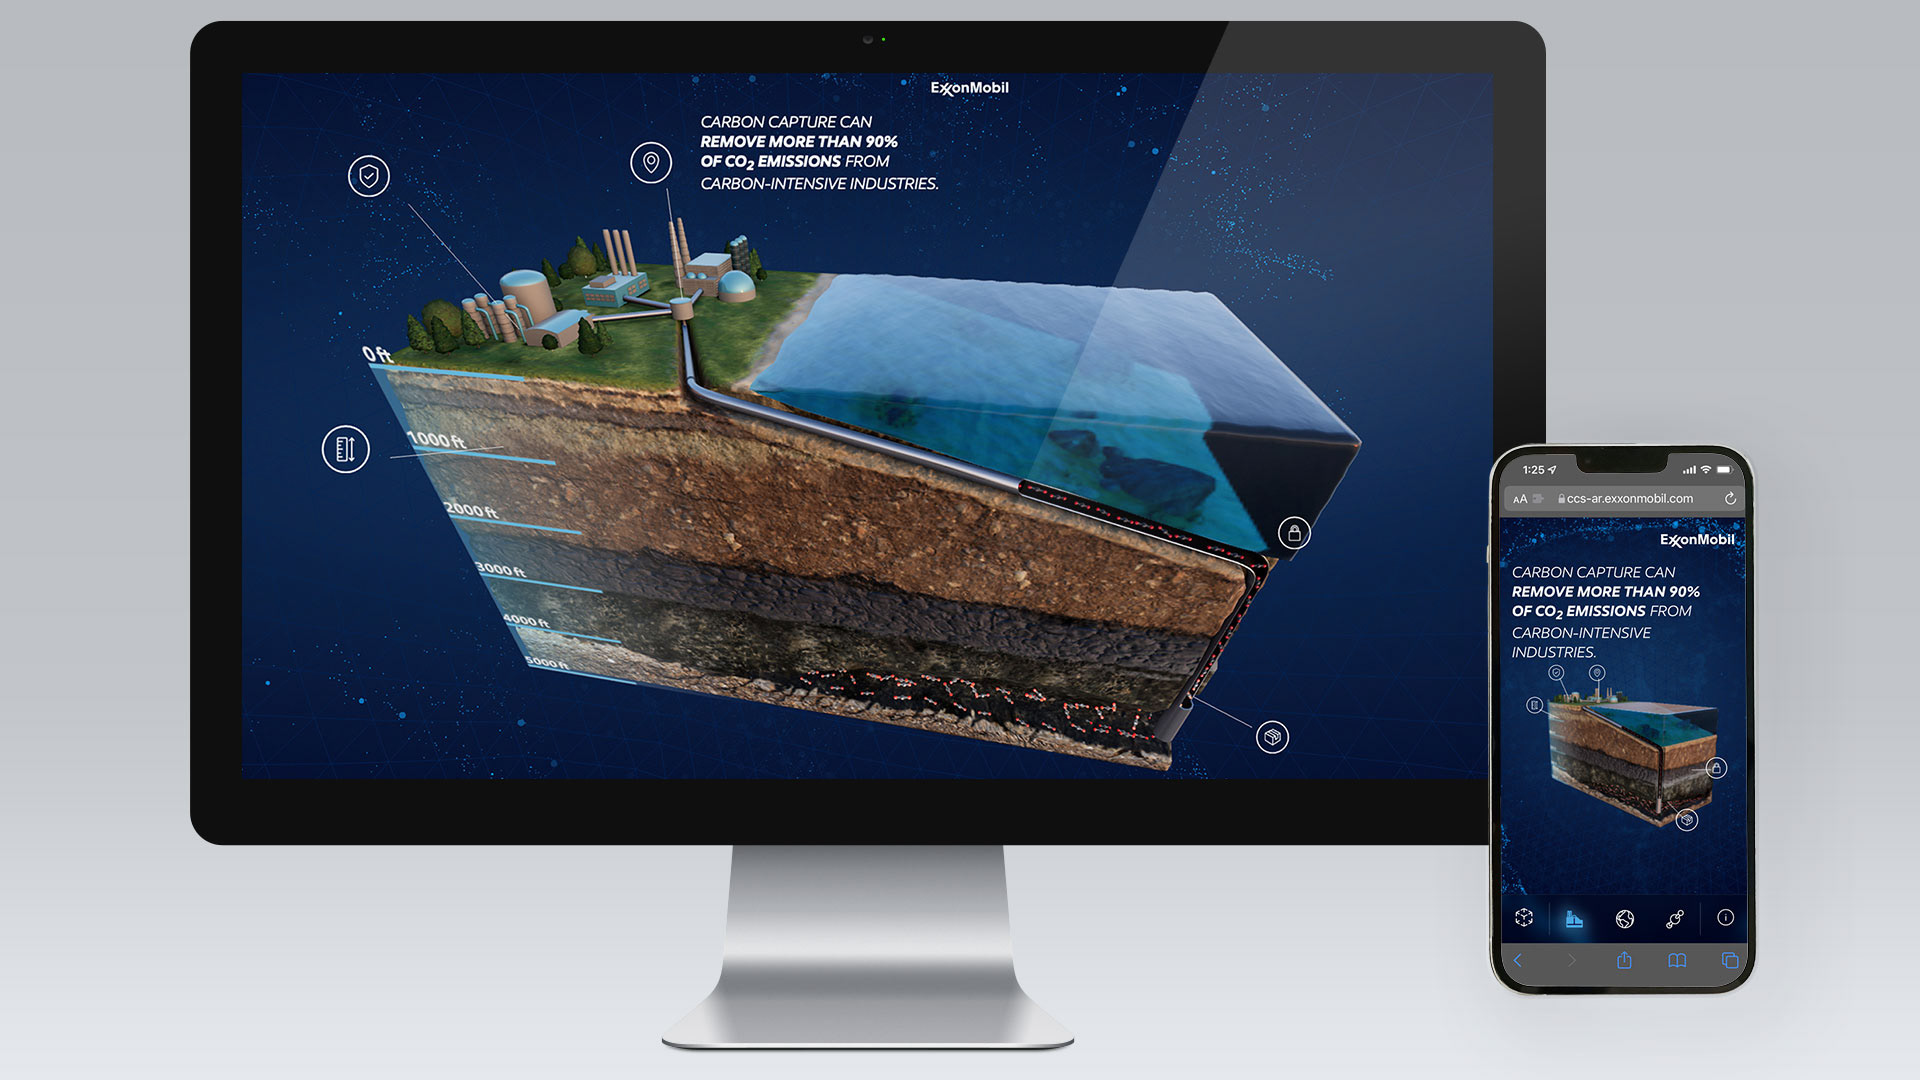
The experience runs on a browser and works on both desktop and mobile devices.
The experience utilized both AR and WebGL to demonstrate the complex concept and importance of CCS (Carbon Capture Storage). Groove Jones worked with ExxonMobil’s agency partner, Group SJR, to tell the story using AR.
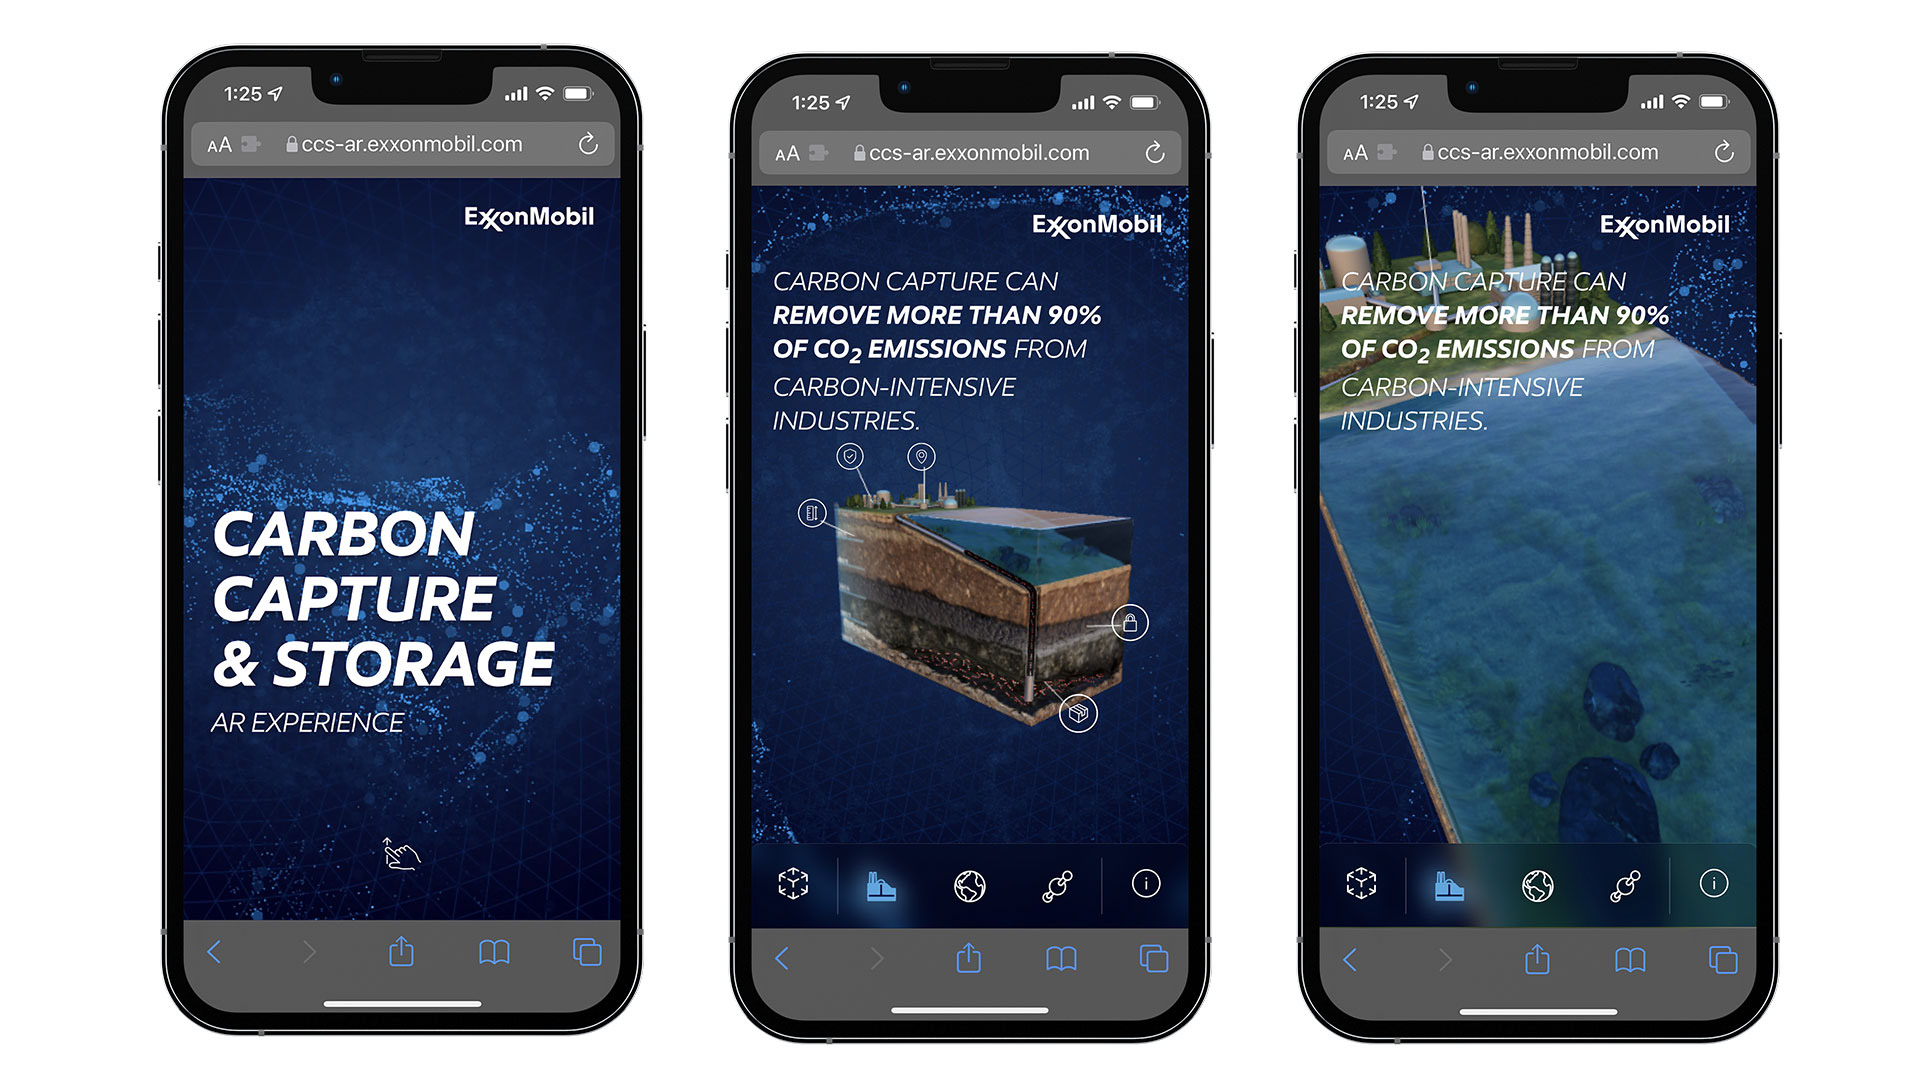
The experience can be launched by scanning a custom QRCode available on the wall mural graphic or by visiting https://ccs-ar.exxonmobil.com
Visualizing a Carbon Capture and Storage Site Story
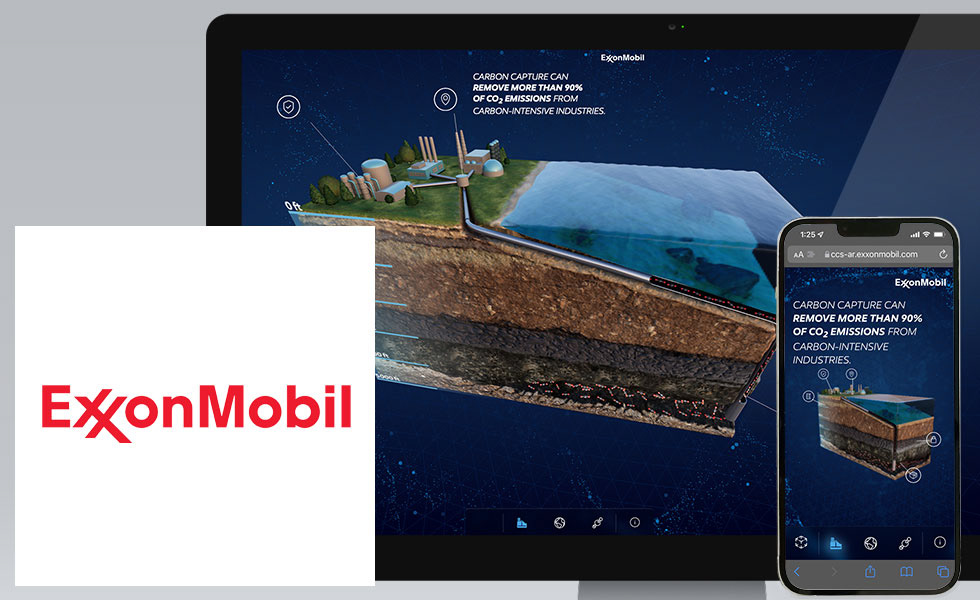
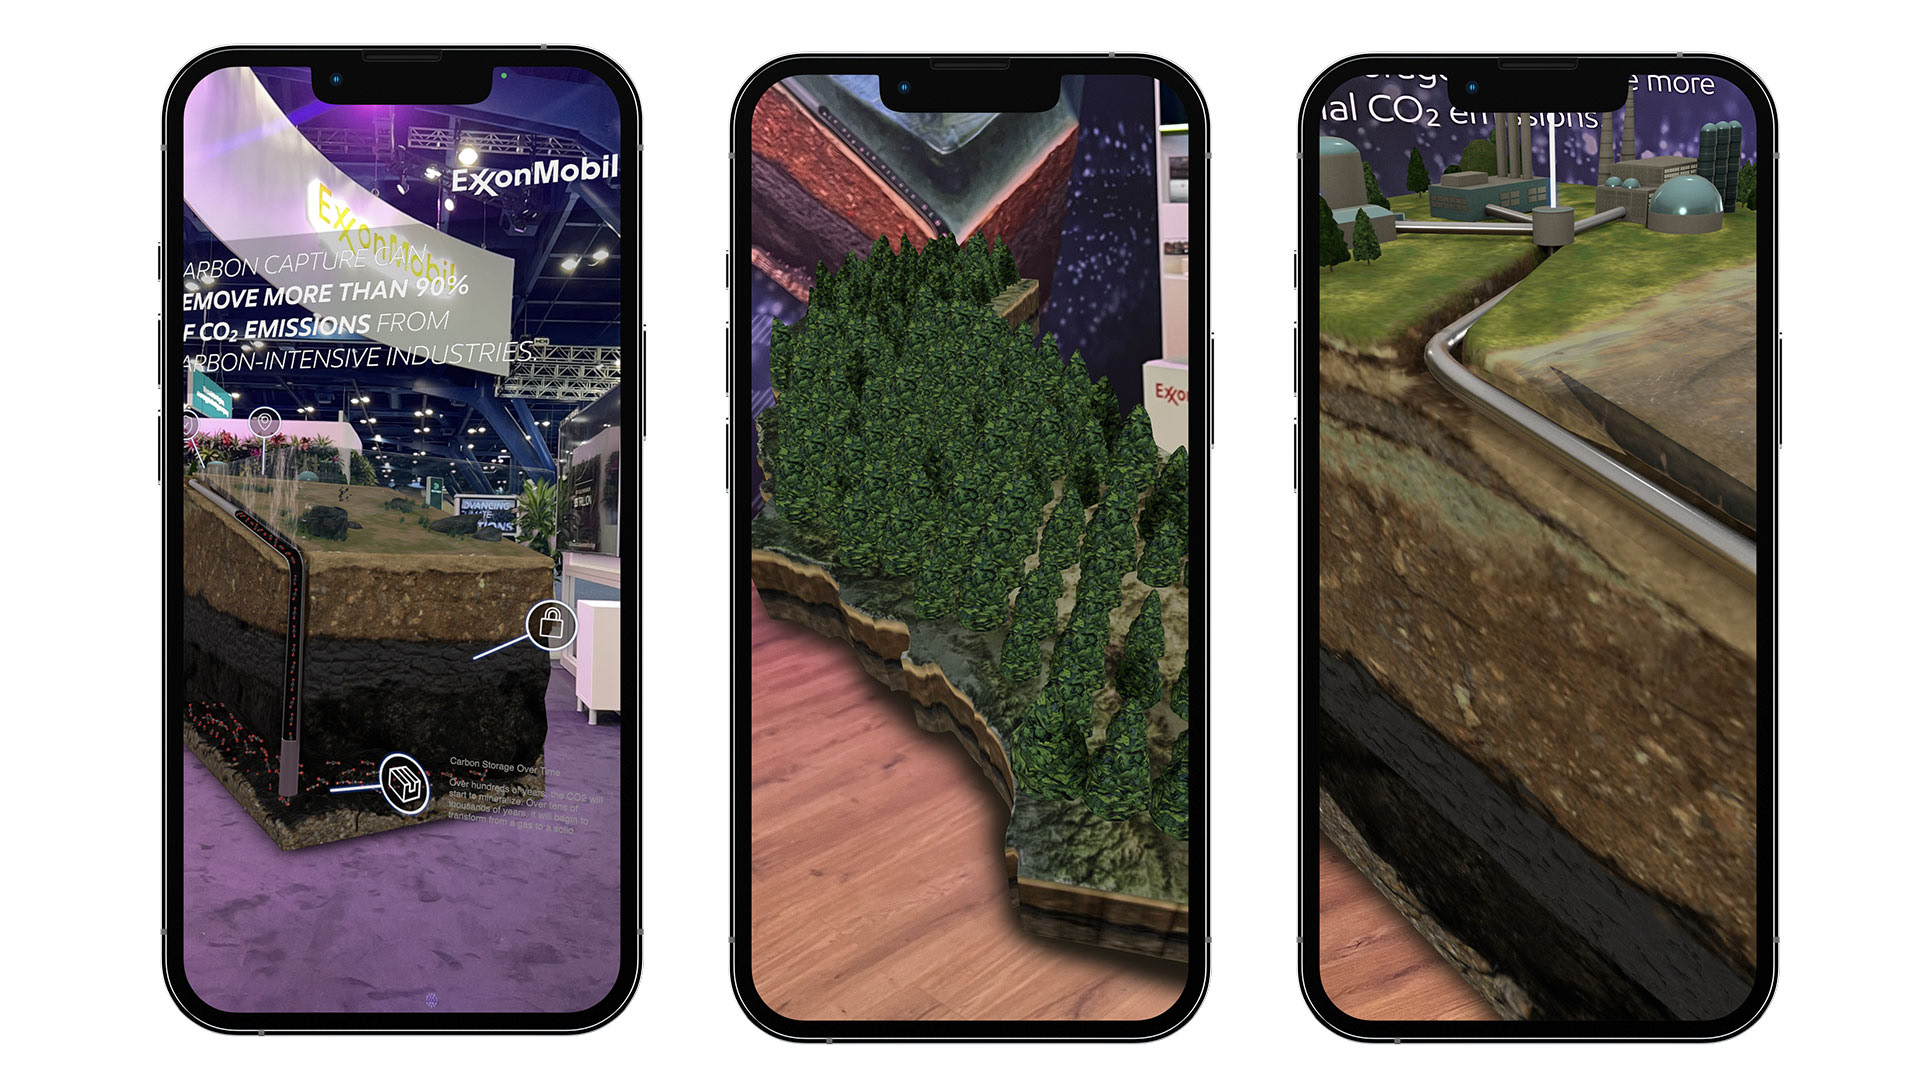
When you visit the site, you begin the experience on a beautifully rendered WebGL landing page that walks you through five key elements of the Carbon Capture & Storage site story. Each element is displayed through compelling 3d visuals that highlight a CCS site. As the user taps on the icons, they are transported to that location at the site.
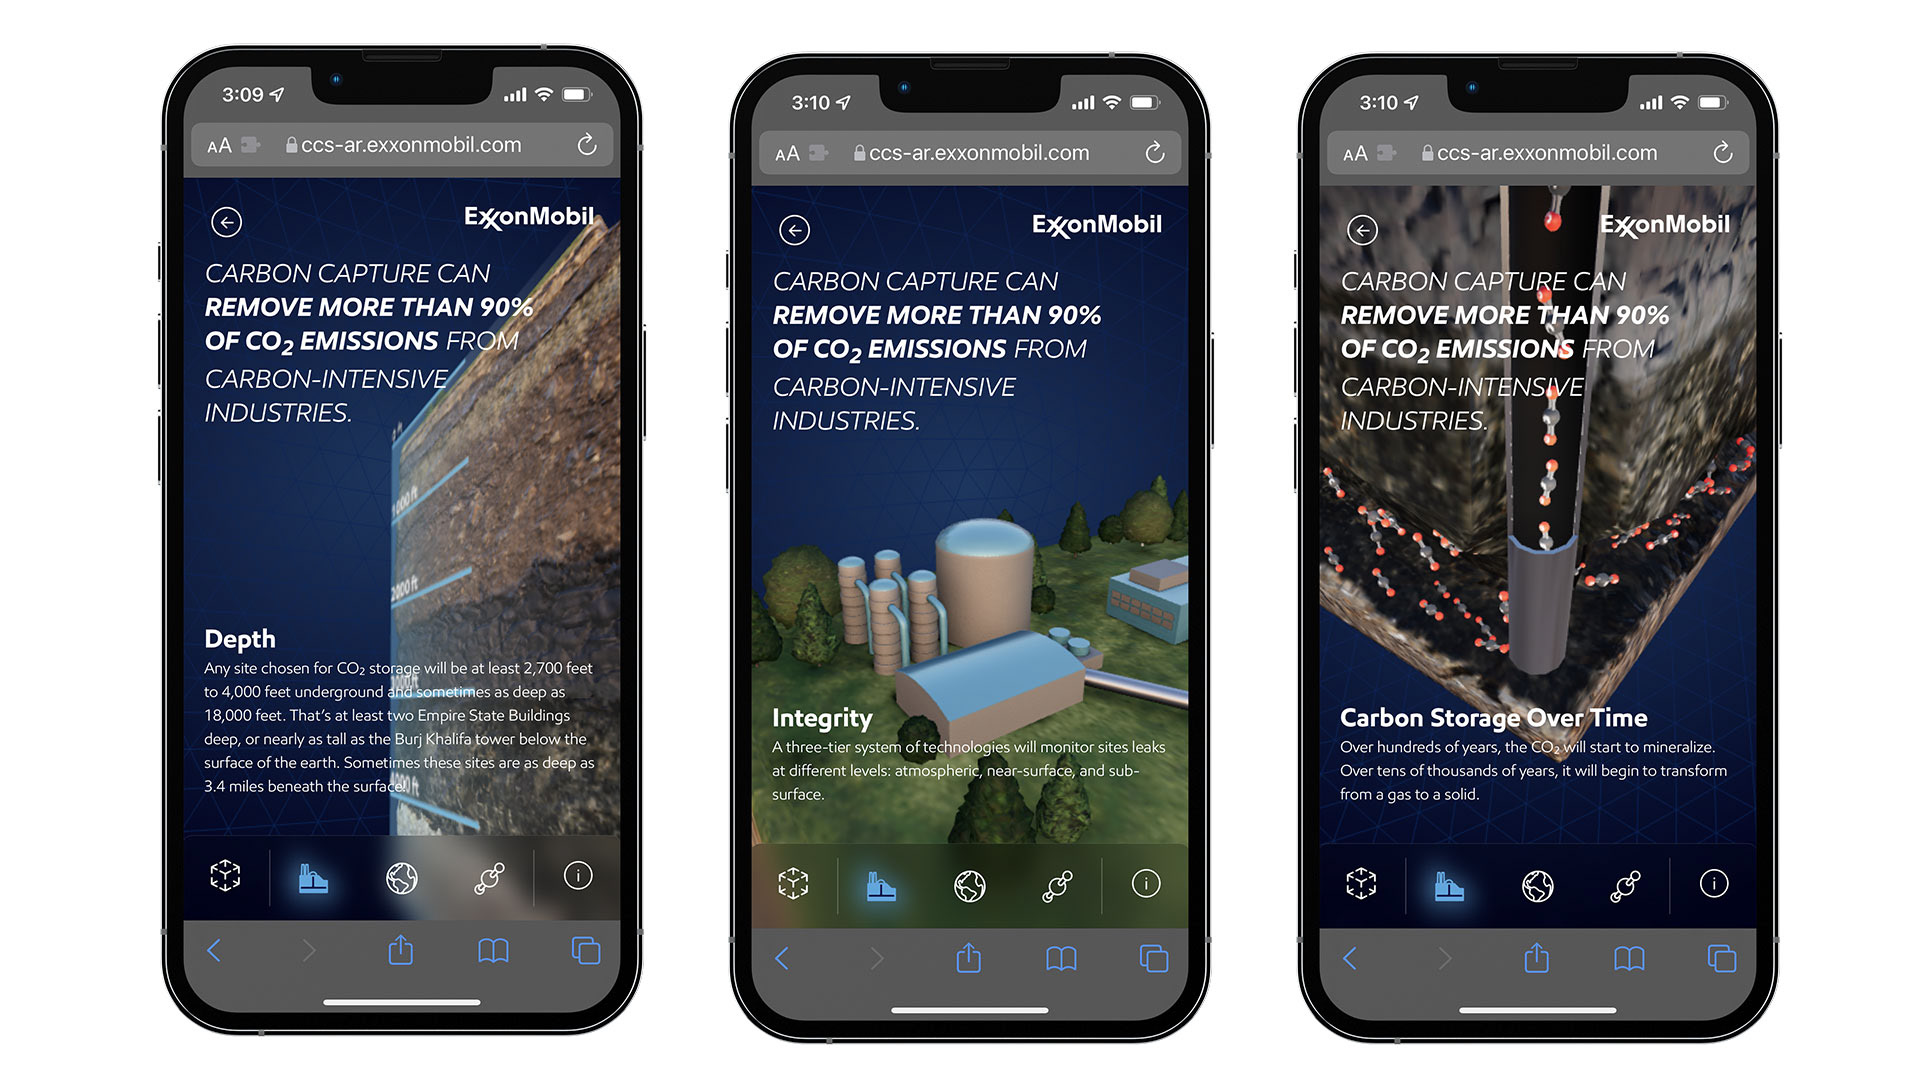
Key elements to the CCS story are Location, Integrity, Seal, Depth, and Carbon Storage over Time.
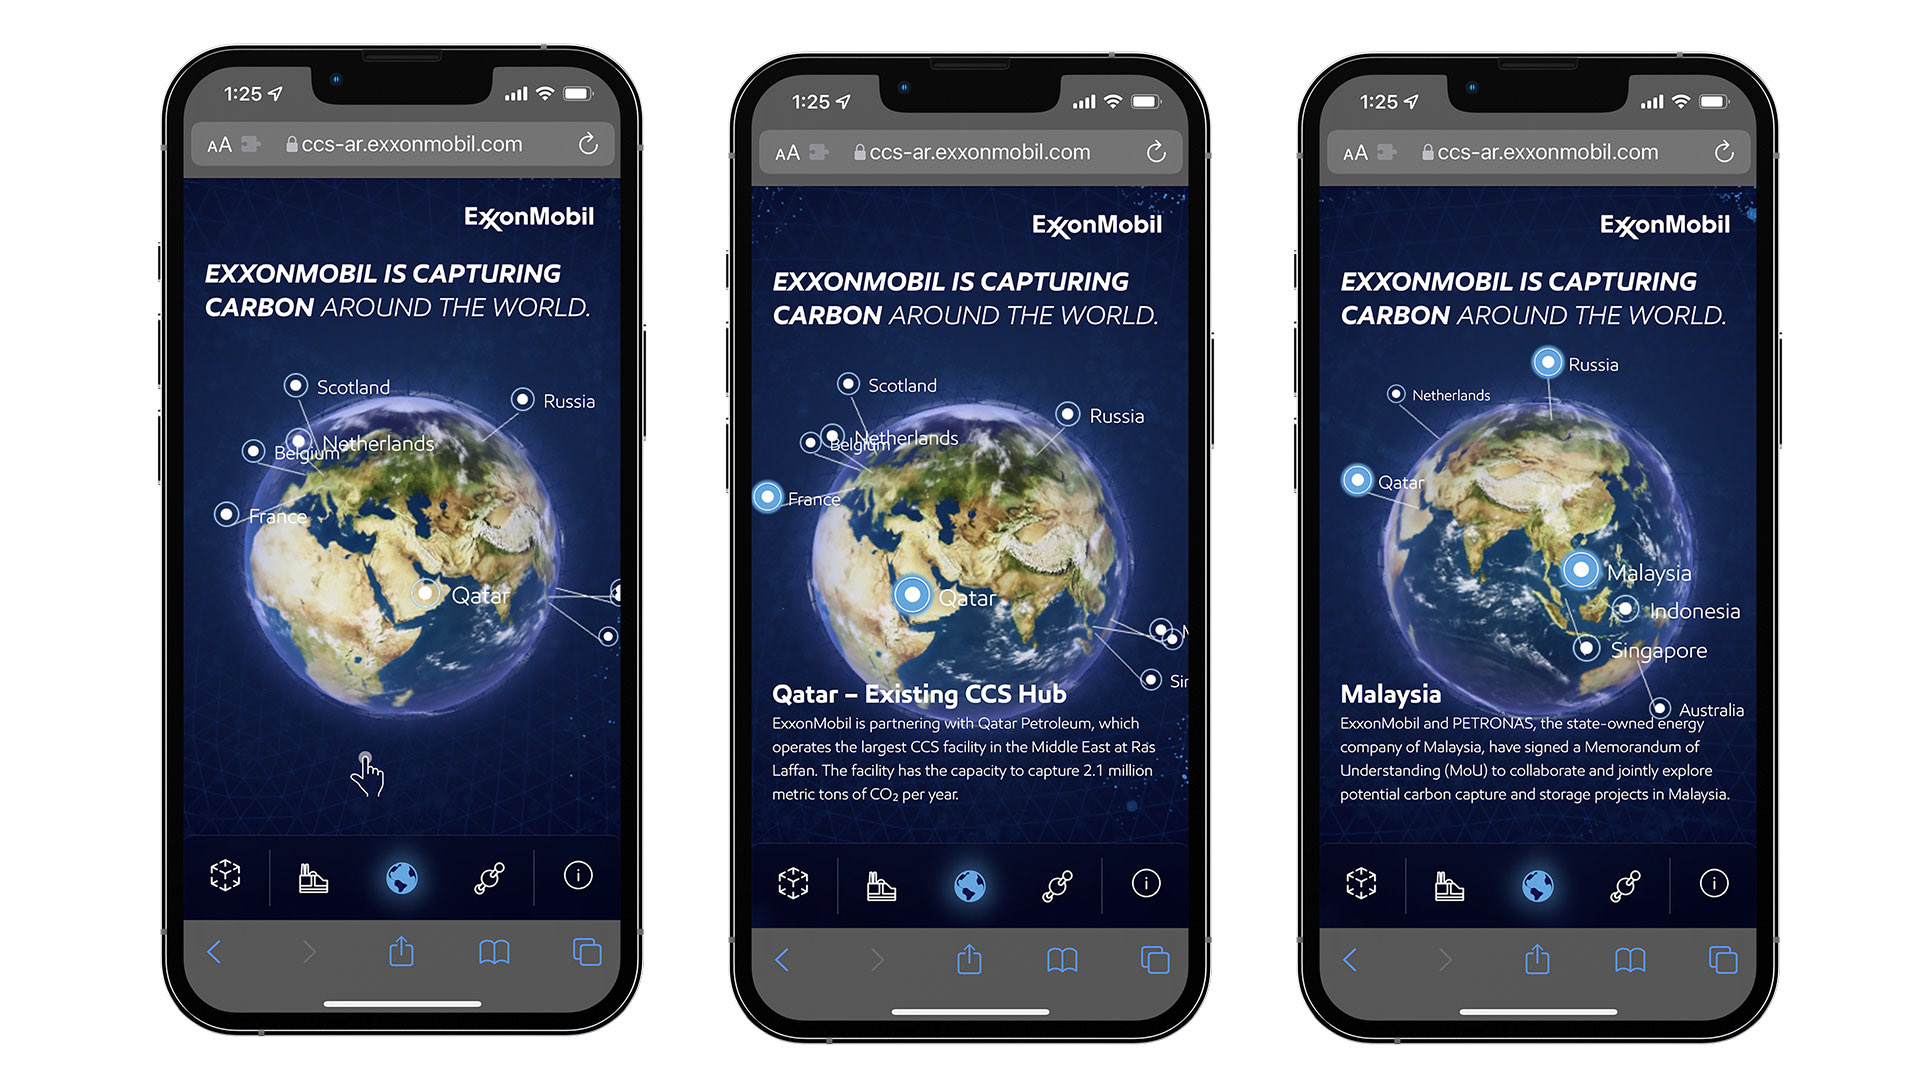
ExxonMobil’s is Carbon Capture Initiatives Around the World
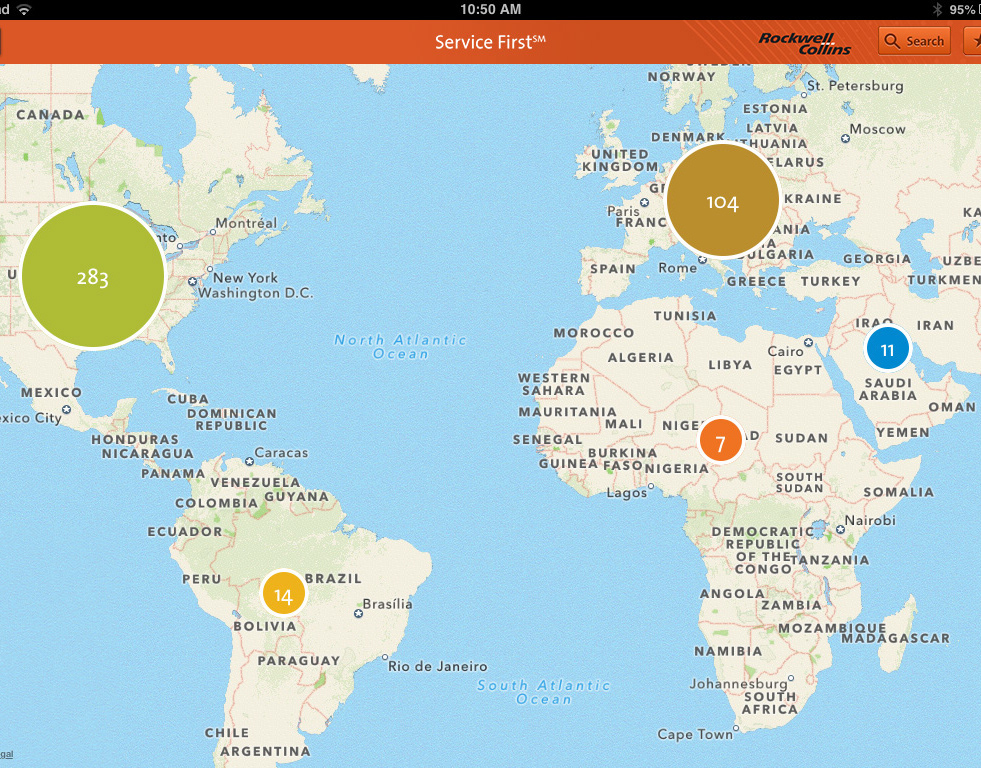
By taping the world icon in the navigation bar, visitors are taken to a 3d view of the world, where they can tap and learn about current examples of how ExxonMobil is committed to advancing innovative solutions for a lower-carbon energy future. We highlight examples across over a dozen locations around the globe.
Integrity - A three-tier system of technologies will monitor site leaks at different levels: atmospheric, near-level, and sub-surface.
Visualizing What 100 Million Metric Tons of CO2
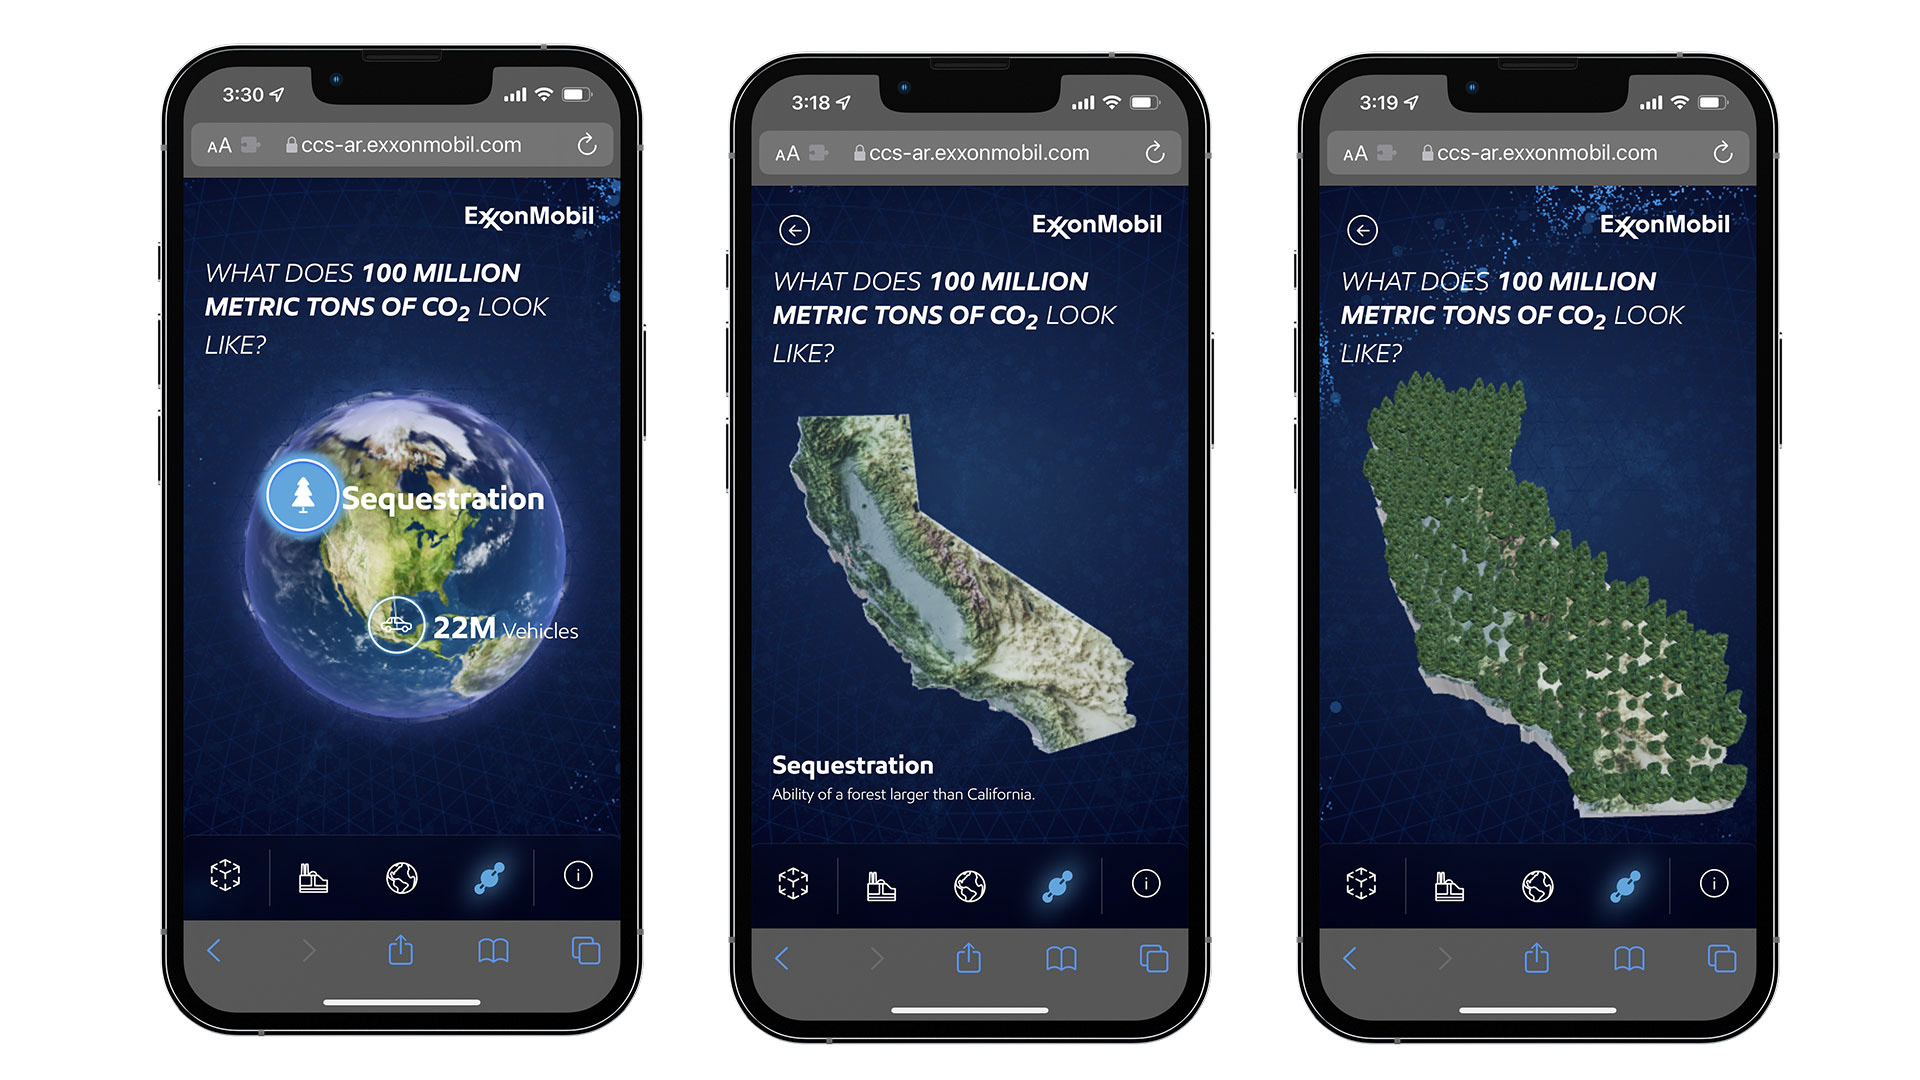
The experience includes an interactive component that helps the user understand what 100 million metric tons of CO2 is equal to through 3d visuals and AR.
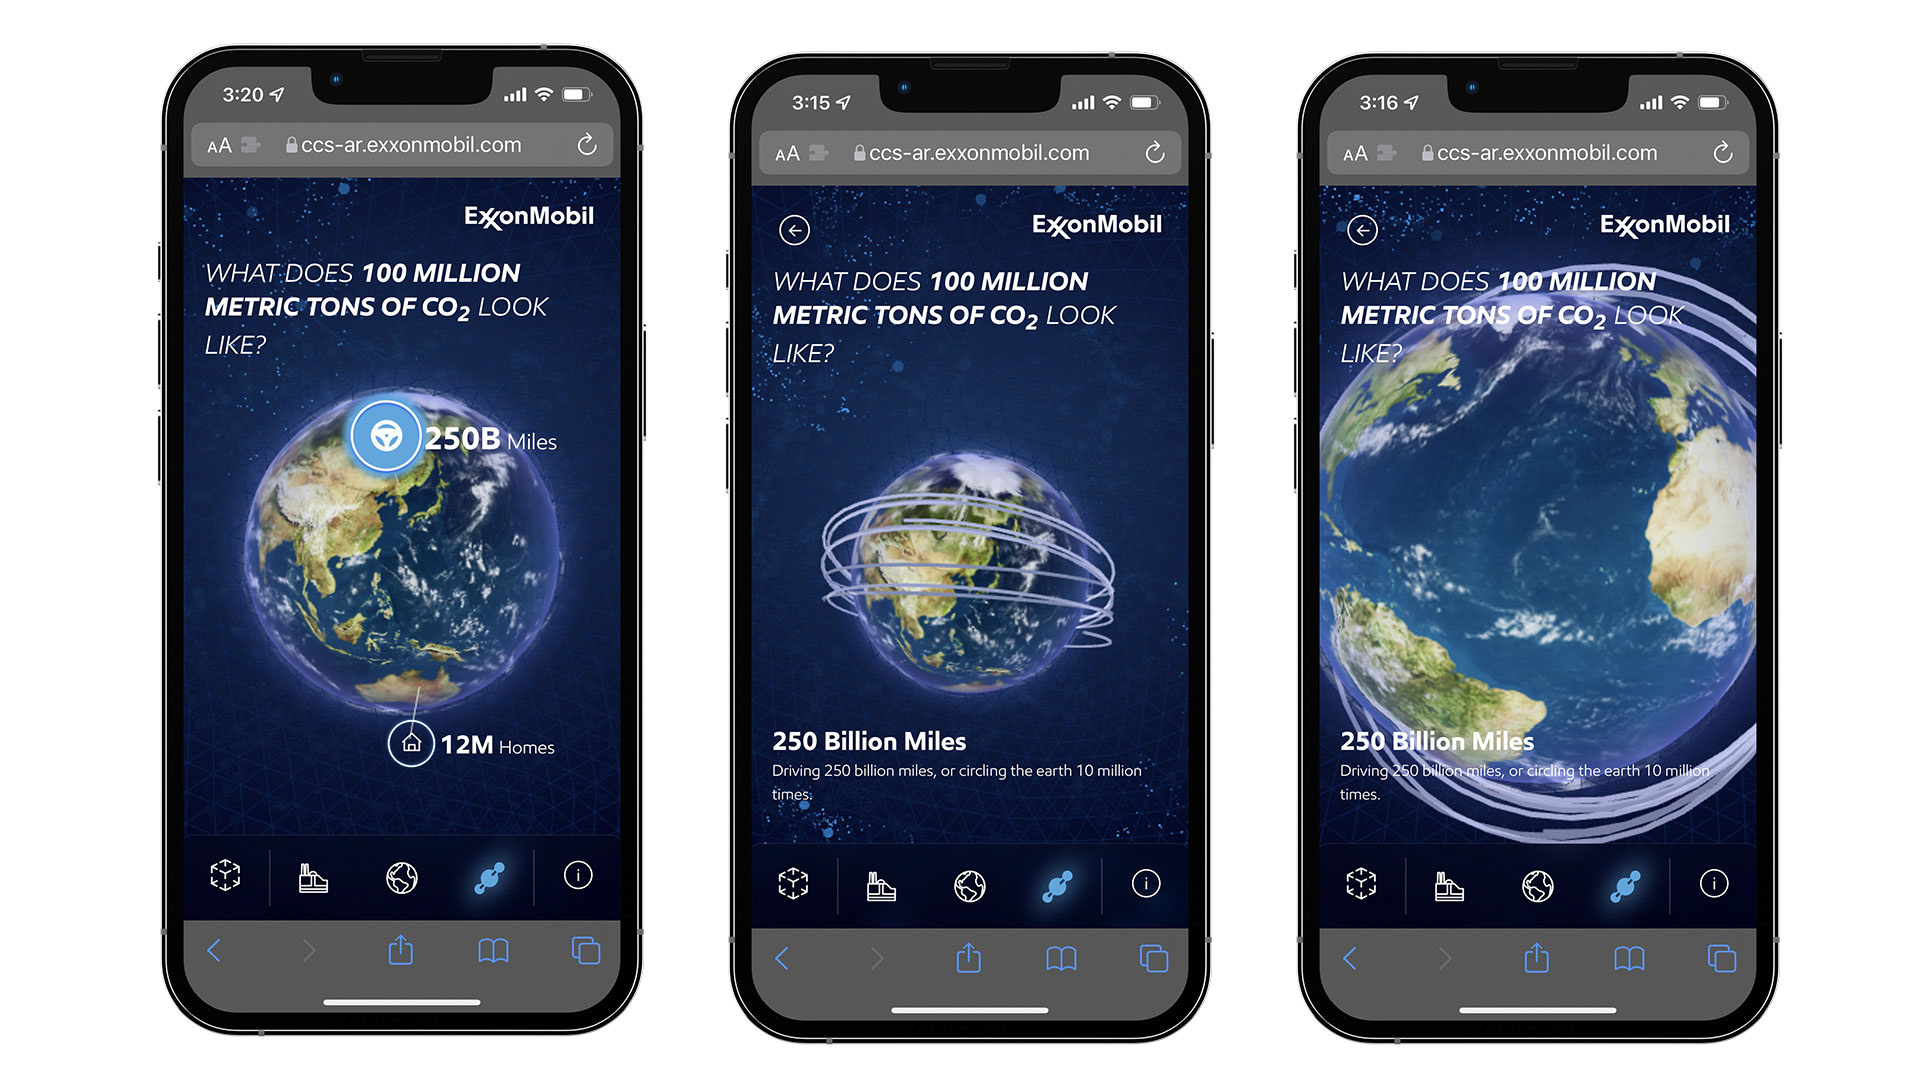
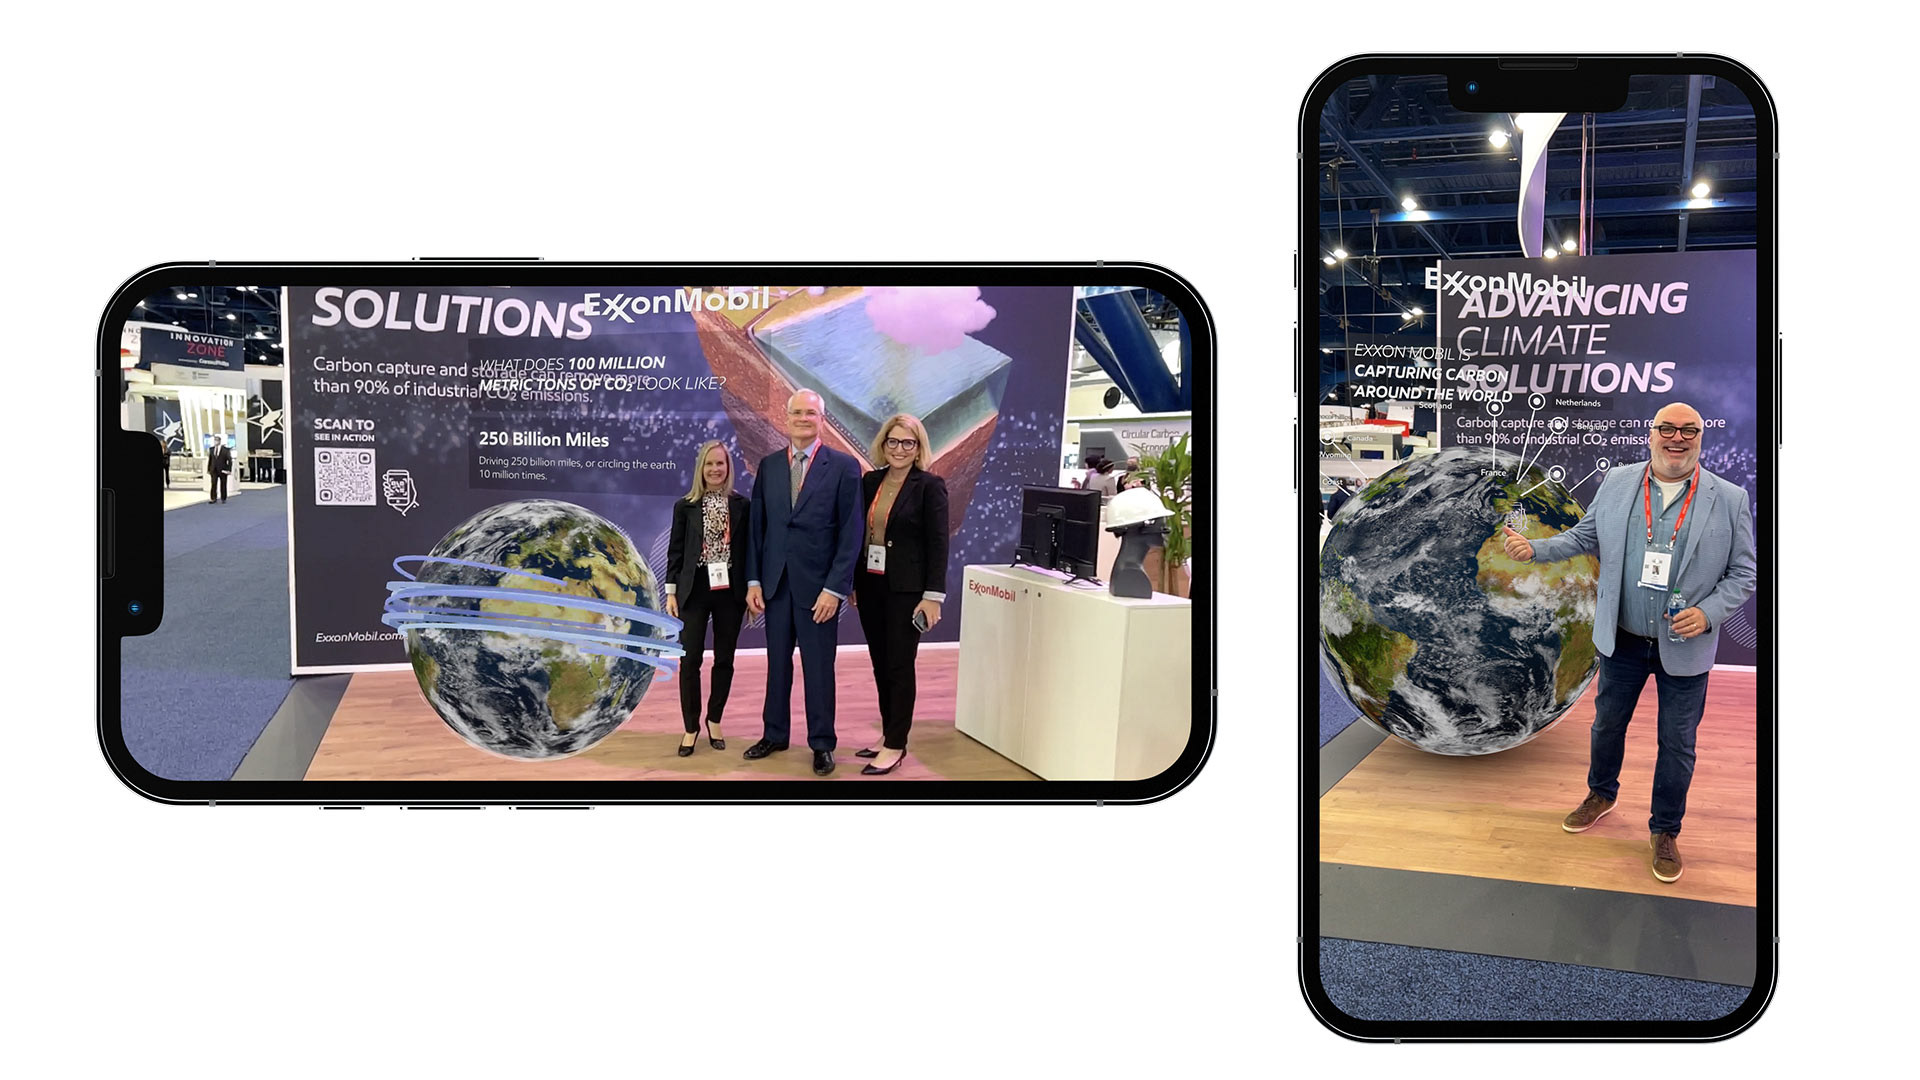
100 Million Metric Tons of CO2 = 250 billion Miles
We visualized driving 250 billion miles or circling the earth 10 million times. Users can tap and zoom in to view the world as an animation of what driving around the world could look like.
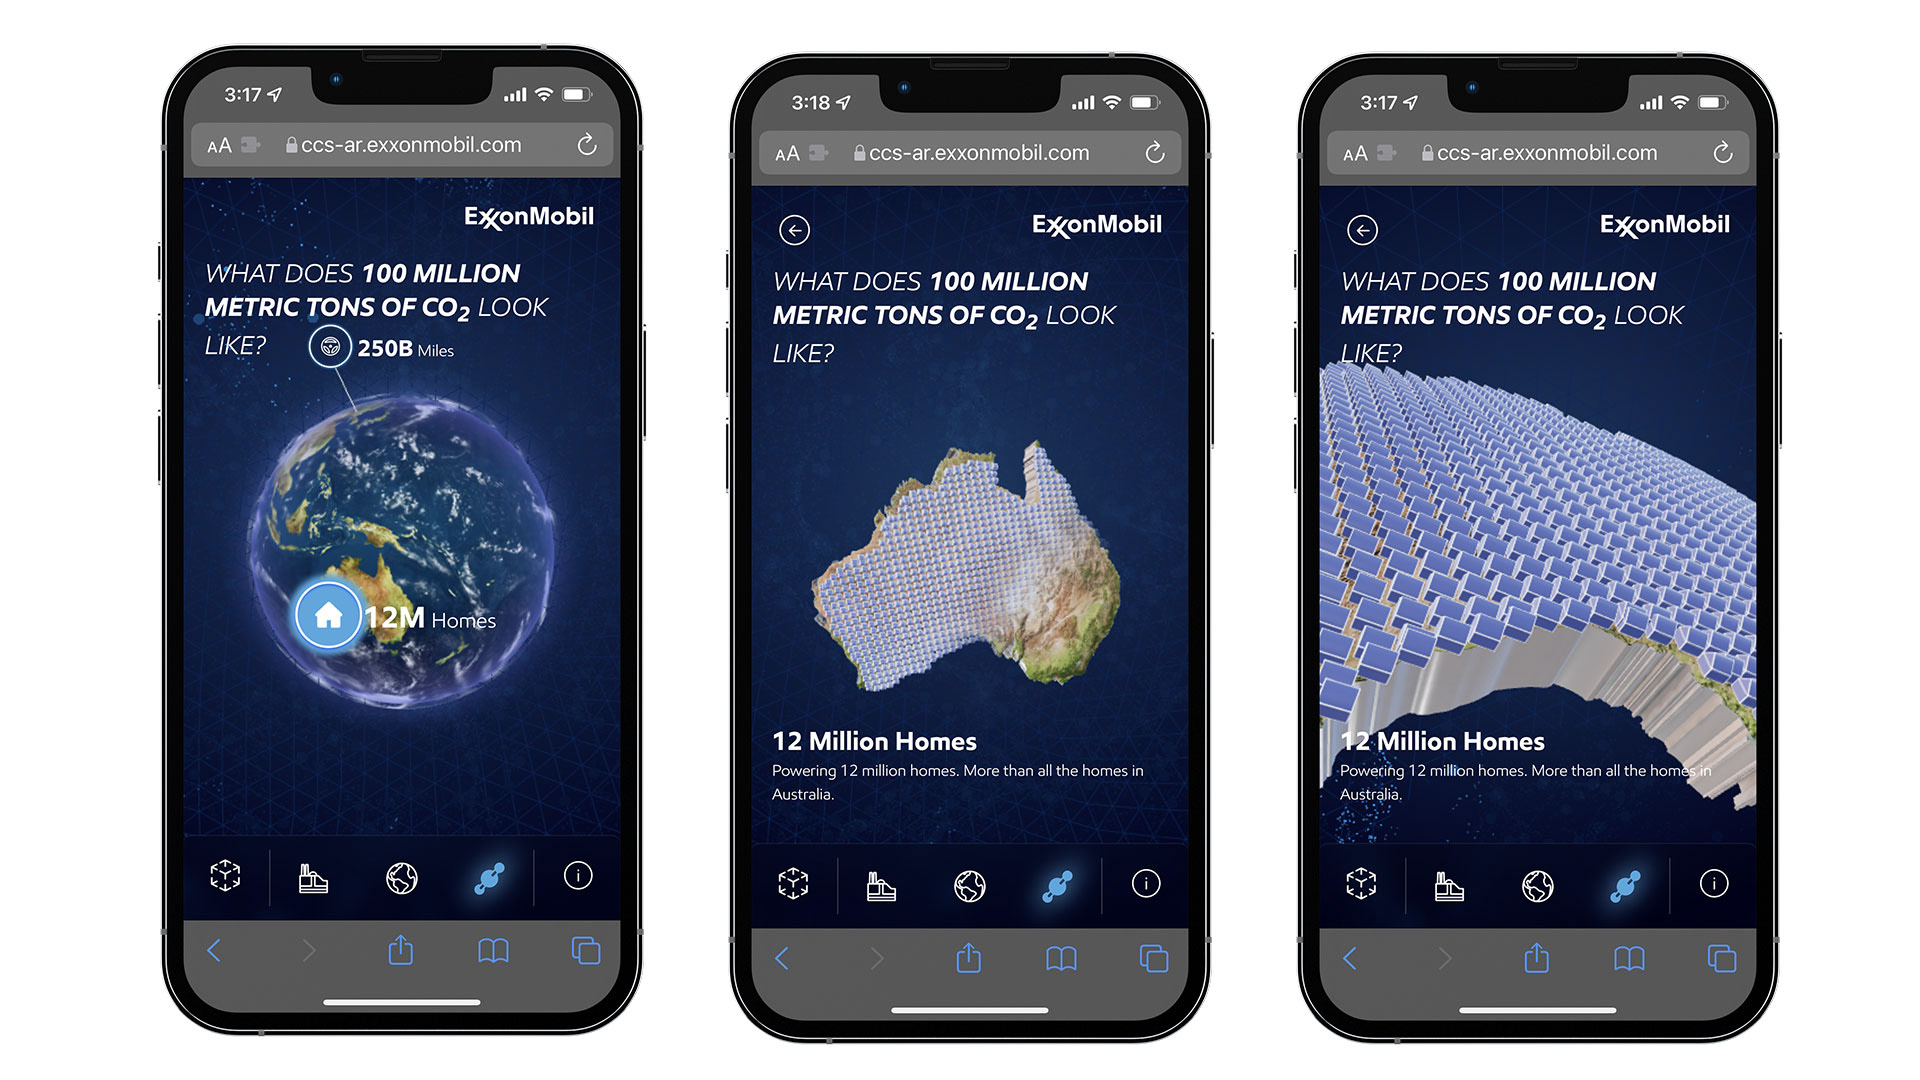
100 Million Metric Tons of CO2 = 12 Million Homes
100 Million Metric Tons of CO2 could power 12 million homes. That’s more than all the homes in Australia. Tap the icon and the camera will take you to Australia and we animate a graphic of 12 million homes appearing over the continent.
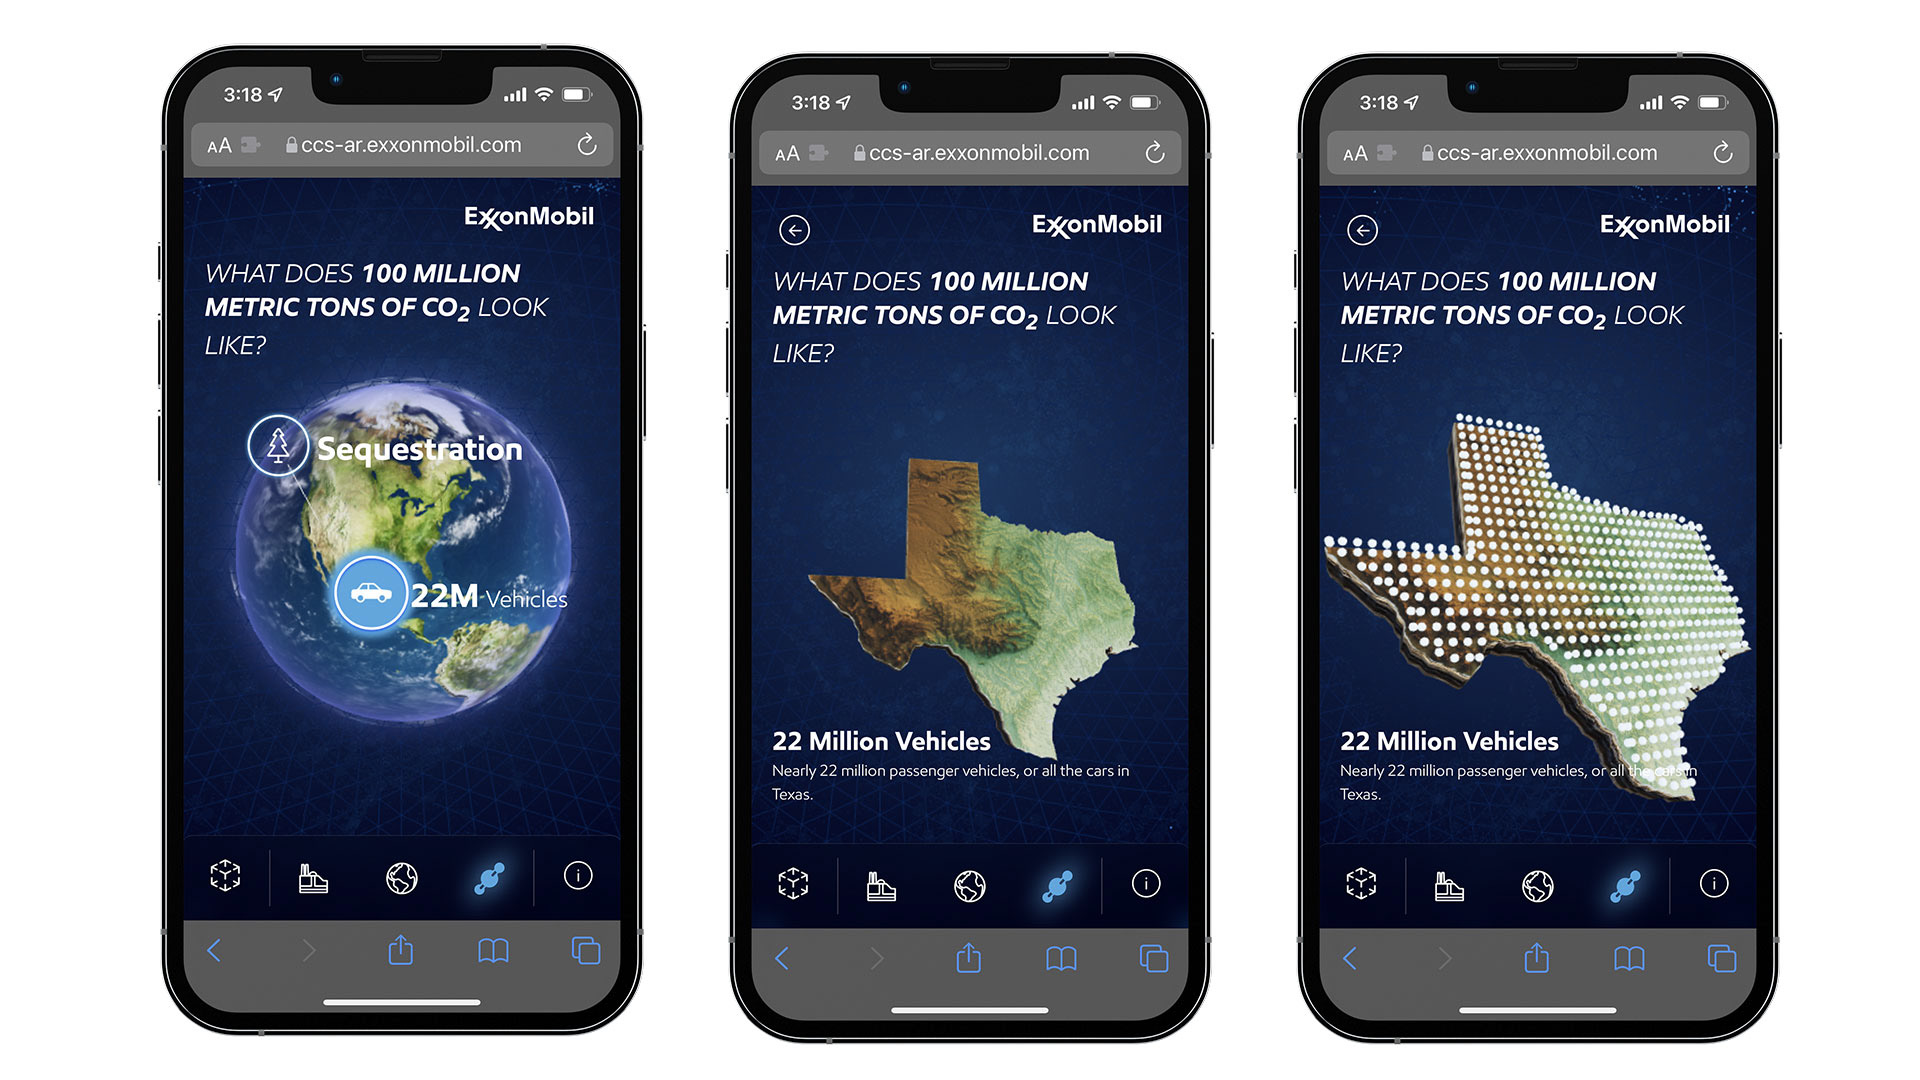
100 Million Metric Tons of CO2 = 22 Million Vehicles
100 Million Metric Tons of CO2 could power 22 million passenger vehicles or all the cars in Texas. Tap the icon and the camera will take you to Texas and activate an animation graphic of those vehicles appearing over the state.
100 Million Metric Tons of CO2 = Sequestration
Using CSS is equal to a forest larger than California to remove 100 Million Metric Tons of CO2. Tap the icon and the camera will take you to California and activate an animation graphic of a forest appearing throughout the state.
AR Visualization for Photo Opps and Dramatic Visualization
By activating the AR mode of the experience we utilized SLAM technologies to place large-scale AR objects with animation for some great photo opportunities and dramatic visual exploration.